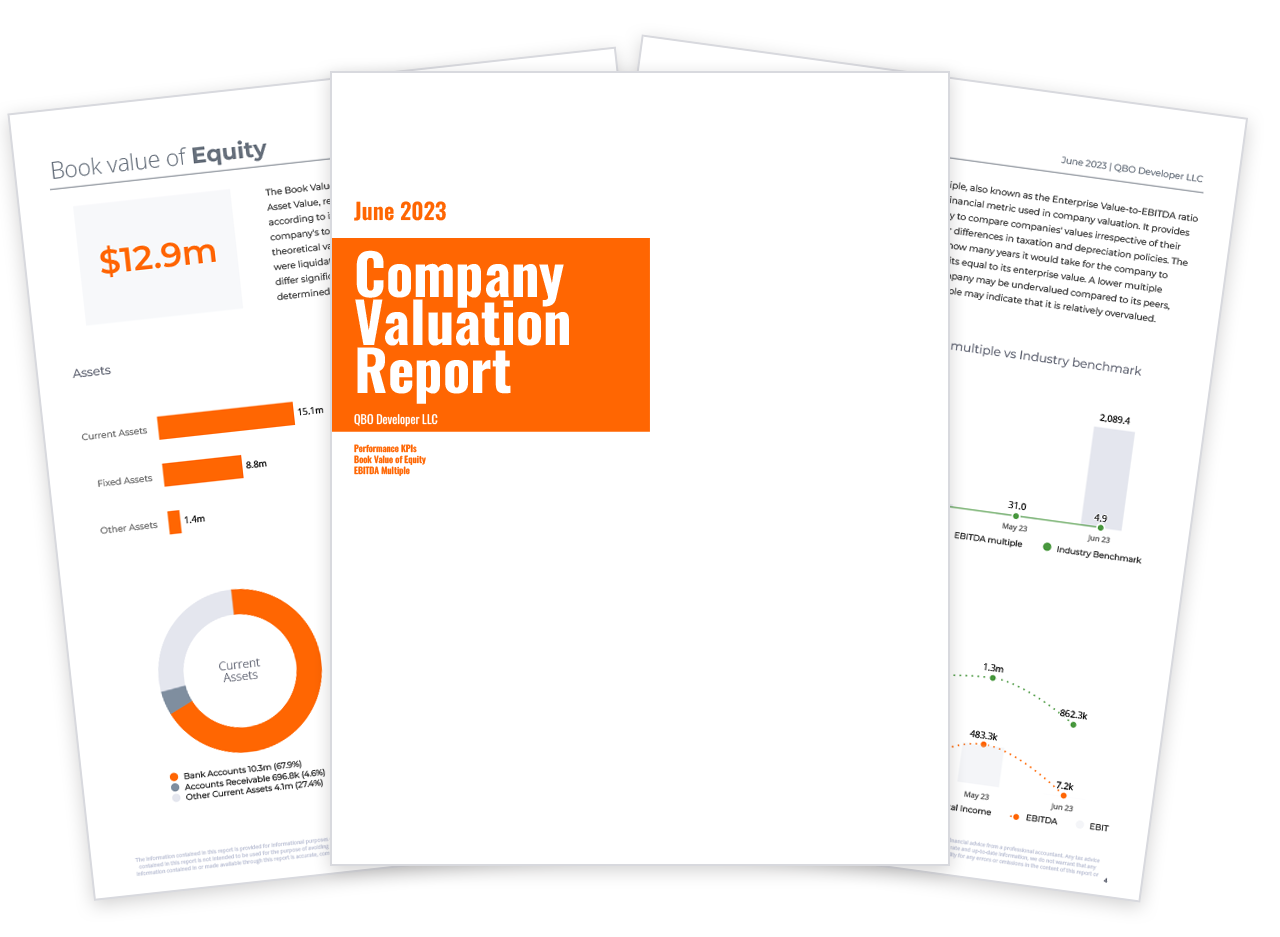
Running a business is a non-stop job. Keeping yourself up to date on the financial in’s and out’s of your company alone could keep you plenty busy. There are a handful of financial reports that need to be reviewed on a regular basis, monthly or at least quarterly. Running these reports and taking the time to review and understand them can and will save you time and money in the long run.
Below are the best financial reports to keep you in the loop. Running them will ensure a better understanding of your company’s financial performance.
1. Income Statement –
This report is also known as a Profit & Loss Report (P&L). The Income Statement condenses total revenues and expenses incurred by the business over a period of time, usually a month, but also is useful to run quarterly or yearly. The statement shows the profitability (net income or net loss) of the company during that time period.
2. Budget vs Actual –
Just as the name suggests, this report compares the information from your Income Statement (what actually happened) with was budgeted to happen. Run this report monthly, quarterly and annually. From this report, the reader will learn how closely (or not closely) the company’s spending and revenue income are to the forecasted budget. Here you will also learn in what areas or departments you can afford to hire additional employees or need to trim spending.
3. Accounts Receivable Aging Report –
Accounts receivable aging is a report or table that categorizes a company’s accounts receivable. It categorizes according to how long an invoice has been outstanding. It is a gauge to determine the financial health of a company’s customers. When this report shows a company’s receivables are being collected too slowly, this is a red-flag that business may be slowing down. It can also mean the company is taking a risk in its sales practices. This is the primary tool used in the collection process.
4. Balance Sheet –
The Balance Sheet is a financial report compiling a company’s total assets, liabilities, and shareholders’ equity. Usually created at a specific point in time, usually at the end of an accounting period. It provides an overall picture of a company’s financial situation, including the economic resources the company owns, owes, and the sources of financing for those resources.
Use the Balance Sheet to pinpoint trends and most importantly, use it to make informed financial and accounting decisions. Lastly, It also provides important information to lenders, they will use it to determine a company’s creditworthiness.
5. Statement of Cash Flows –
This report is often the most critical and gives a business owner the net difference of cash that came in and cash that went out on an operating level. It combines the information from the income statement and the balance sheet. This report can be an excellent way to see the overall health of a company.
6. Net Profit Margin Over Time –
Tracking your companies Net Profit Margin over time helps managers and business owners understand and manage pricing, expenses, and sales efforts. Net Profit Margin shows the percentage of revenue remaining once operating expenses, interest, taxes, and preferred stock dividends have been deducted from a company’s total revenue. Running this report will give you heads up if/when costs change that in turn cut into your NPM. NPM can vary from season to season and from industry to industry, don’t forget his when comparing numbers.
Need help running these reports? Here at Reach Reporting, financial reports are beyond easy (a few clicks of your mouse kind of easy!) to run and even easier to understand. Because what good is having a report that is hard if not impossible to understand? Check out our pricing page or sign up for a free 14-day trial. See how these reports and many others can change your perspective on your business financials.

