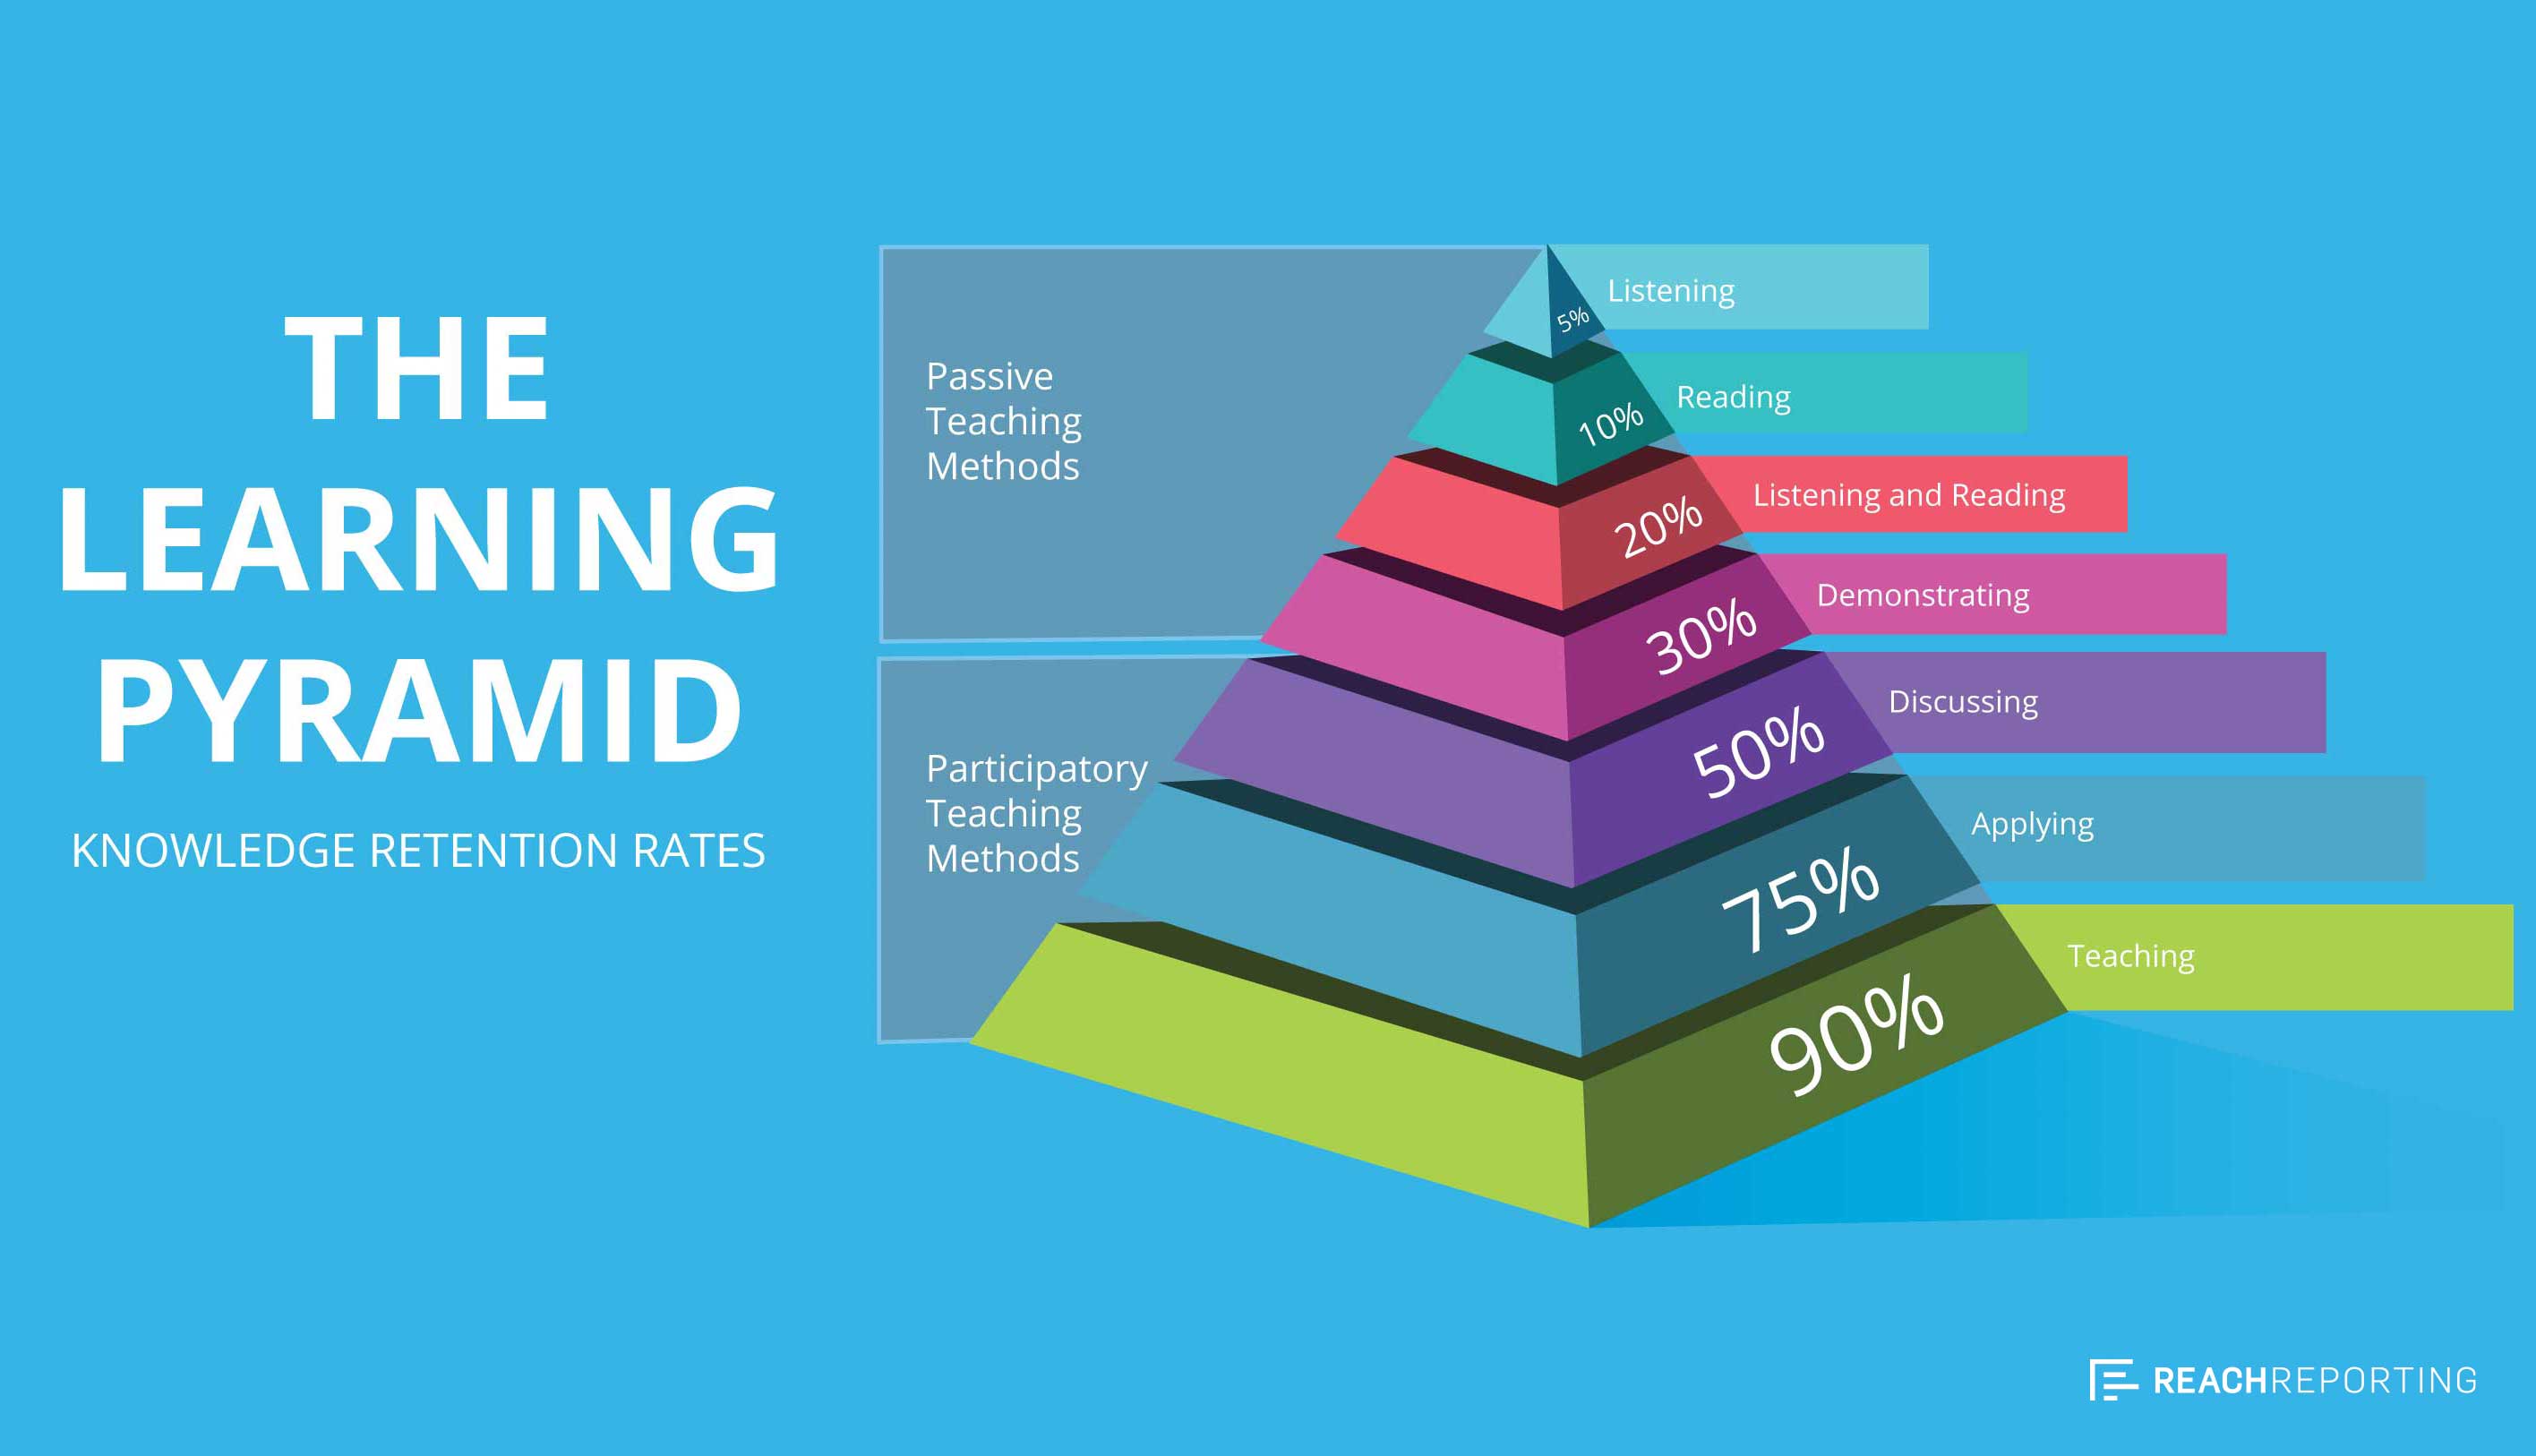
We live in a dynamic business world where financial advisors, accountants, and consultants’ roles extend far beyond just managing numbers. It’s about illuminating the path for clients and helping them make informed decisions through insightful guidance. To elevate your client relationships, moving past traditional methods and embracing the power of visual reporting, budgeting, and forecasting is essential.
Let’s delve into the Learning Pyramid to see how these tools can revolutionize client retention and decision-making.
Level 1: The Power of Listening (5% Retention)
At the base of the Learning Pyramid lies listening. Traditional reporting often limits clients to just hearing about their financial data, leading to low engagement and retention. It’s a foundational step, but there’s much more to explore.
Level 2: Enhancing Understanding through Reading (10% Retention)
As we ascend the pyramid, reading comes into play. While clients may receive written reports, the retention here is still lower. It’s a step up, but we’re aiming higher.
Level 3: Combining Listening and Reading (20% Retention)
Merging auditory and written information, this level offers a better grasp of details. Yet, it’s still not quite the game-changer in creating actionable insights.
Level 4: The Clarity of Demonstrating (30% Retention)
Here’s where the shift happens. Visual reporting introduces graphs, charts, and visualizations, transforming complex data into clear, engaging formats. This approach significantly enhances understanding, making the data seen and felt.
Level 5: The Engagement of Discussing (50% Retention)
Discussion breathes life into financial insights. Clients actively engage with visual reports, asking questions and gaining a deeper understanding. This interactive phase is crucial for informed decision-making.
Level 6: The Impact of Applying (75% Retention)
Application is where theory meets practice. Clients use visual tools for budgeting and forecasting, playing out scenarios, and making informed, data-driven decisions. The knowledge becomes a tool in their strategic arsenal.
Level 7: The Mastery of Teaching (90% Retention)
Reaching the summit, clients transform into educators. They spread their financial acumen within their teams, creating a ripple effect of data literacy. This level ensures that insights from visual tools become embedded in their strategic thinking.
Conclusion
A New Era of Client Relationships By leveraging visual reporting, budgeting, and forecasting, you guide your clients through each stage of the Learning Pyramid. Transitioning from passive absorption to active engagement, not only enhances retention but also empowers decision-making.
Equip your clients with the tools and insights they need to thrive. It’s more than data presentation; it’s about fostering transformative relationships and steering them towards their strategic objectives.

